Hidden Divergence
by www.surefire-trading.com
Ty Young
To Download This Report - Right Click Here
Hi, this is Ty Young with Surefire-Trading.com bringing you another exciting point of conversation.
Isnt it interesting how we in the Trading industry have taken common everyday words of interest and refashioned them to suit our needs? For instance, lets take the words trend and line. Grammatically speaking, when we use these two words consecutively, the word trend is an adjective that is describing the noun line. And as such, they are written as two entities.
However, in our world, trend line has evolved becoming an entity in itself, which we use as the compound word trendline. An identity that Websters Dictionary and Microsoft Word still, to this day, cant wrap their heads around.

Divergence is such a word...
Google the word divergence and you will quickly see what I mean. In our world, divergence has taken on a characteristic all its own. So, sit back and relax as we delve into its nature and how we may use it to identify and confirm higher probability trades.
Among other indicators, our previous lessons have covered topics such as the MACD and the RSI. Lets broaden our use of these tools by combining them with divergent formations so we may increase our profit margin.
In this lesson do not confuse divergent trendlines
with your standard trendlines.
When drawing your standard bullish trendlines, they are drawn connecting the higher lows. Subsequently, when drawing your standard bearish trendlines, they are drawn connecting lower highs. Lets see how this differs from divergence.
Divergence vs. Hidden Divergence
Divergence
As many of you well know, most of my trading is intra-day. Generally speaking, I am a Day Trader. While indicators and trendline breaks are a large part of my trading strategy, divergence can be equally important in calculating strength and weakness of any currency. And though the majority of my trades have been closed within 24 hours of entering the market, Ive come to realize that divergence, when understood and utilized correctly, can be an awesome asset to trading at the higher time frames, such as, daily, weekly, and monthly charts.
This is because indicators such as the MACD give stronger and
more accurate signals when longer-term data is calculated.
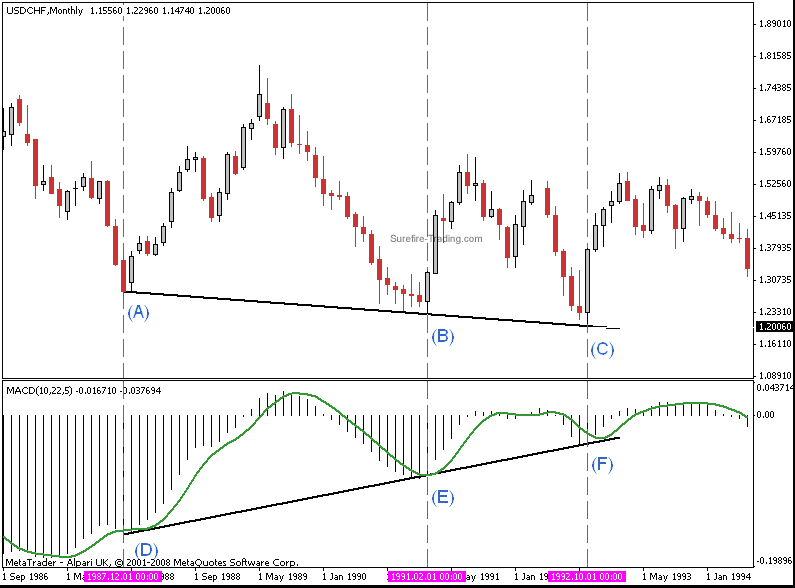
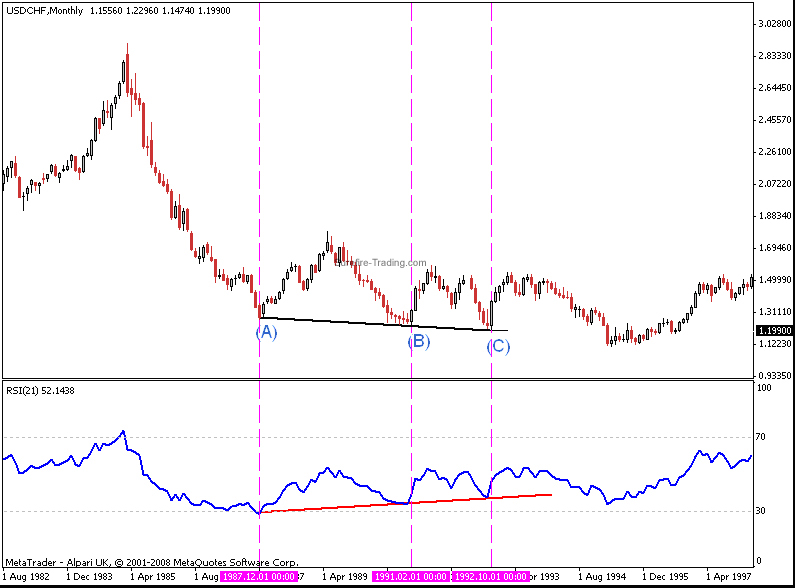
In December 1987, February 1991, and October 1992 (below), the Monthly USD/CHF chart formed a series of new lows (A), (B), and (C). If you follow the vertical lines downward, you can see that these valleys on the price chart coincide with new lows on the MACD indicator. However, each of these MACD lows did not reach the same depth of the previous low in fact, each low was substantially higher (D), (E), and (F).
-
This is called divergence; and in this case, specifically, bullish divergence.
-
When using an adjective to describe (standard) divergence, it takes its name from the direction of the indicator not the price chart.
-
In other words, when the price moves upward, while the indicator moves downward, we call this bearish divergence.
-
Conversely, when the price moves downward, while the indicator moves upward, we call this bullish divergence.
-
When the price (above) retested the previous lows and subsequently coincided with the MACD rising - divergently, we know that the MACD is expressing a potential for the market to increase in strength.
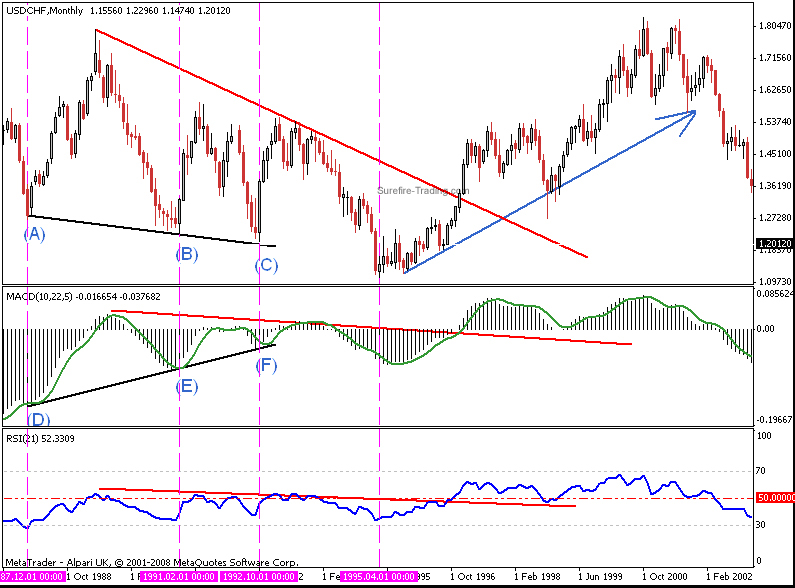
As can be seen in the subsequent chart below, the contrast between the price chart and the MACD provided forewarning to a tremendous reversal opportunity; which, by the way, was confirmed by trendline breaks (red) on the price chart, on the MACD, and on the RSI.
Below, we have an example of bearish (standard) divergence.
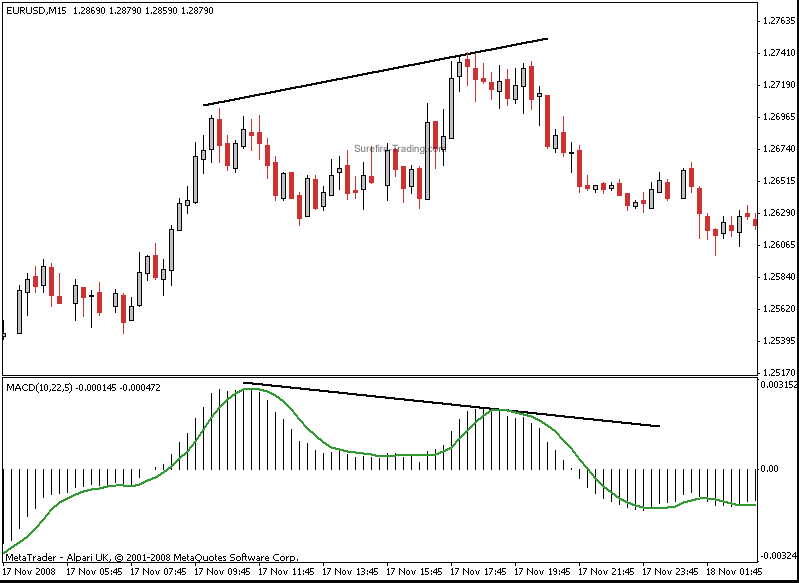
And as can also be seen in the chart below, the contrast between the price chart and the MACD provided forewarning to a tremendous reversal opportunity; which also was confirmed by trendline breaks (red) on the price chart, on the MACD, and on the RSI.
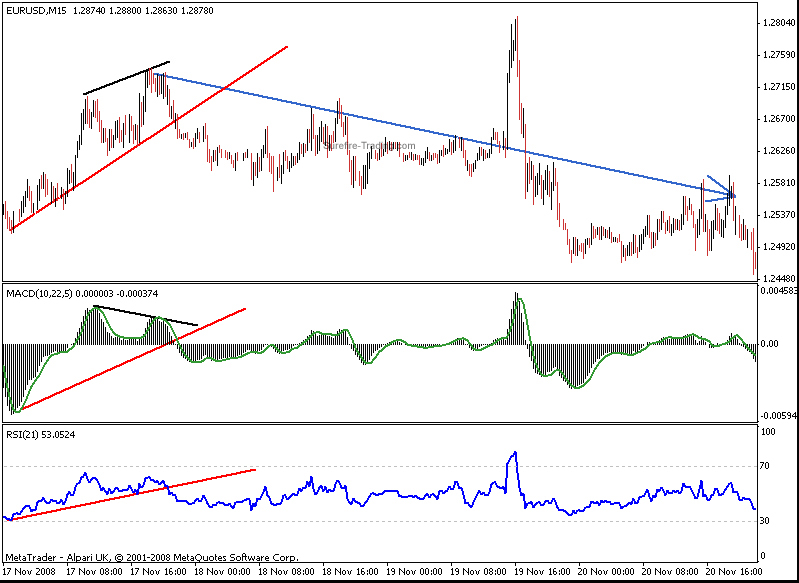
Although the MACD is ideal for determining divergence, divergence can also be found in other indicators as well - such as in this chart of the RSI. Later in this lesson, you will see the Stochastic used to signal a form of divergence as well.
Hidden Divergence
In addressing Hidden Divergence (HD), lets emphasize something important right now while divergence signals a potential retracement or reversal in the market, this is contrary to Hidden Divergence in that HD confirms the continued trend. So, if you see what you think is HD but it Does Not take you back into the trend...
it is not Hidden Divergence.
-
In other words, bullish HD appears in up-trending markets while bearish HD appears in down-trending markets.
So, without insulting anyones intelligence or for fear of overstating the obvious, Hidden Divergence displays itself opposite to that of its counterpart the Divergence.
So, please follow me here...
IF
-
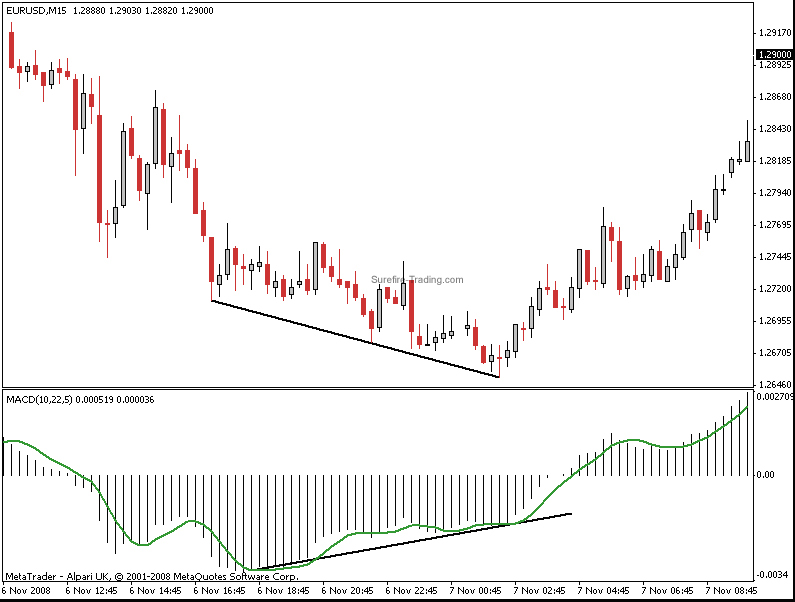
Bullish Divergence (below) is displayed when price reaches lower lows while the coinciding indicator reaches higher lows.
AND
-
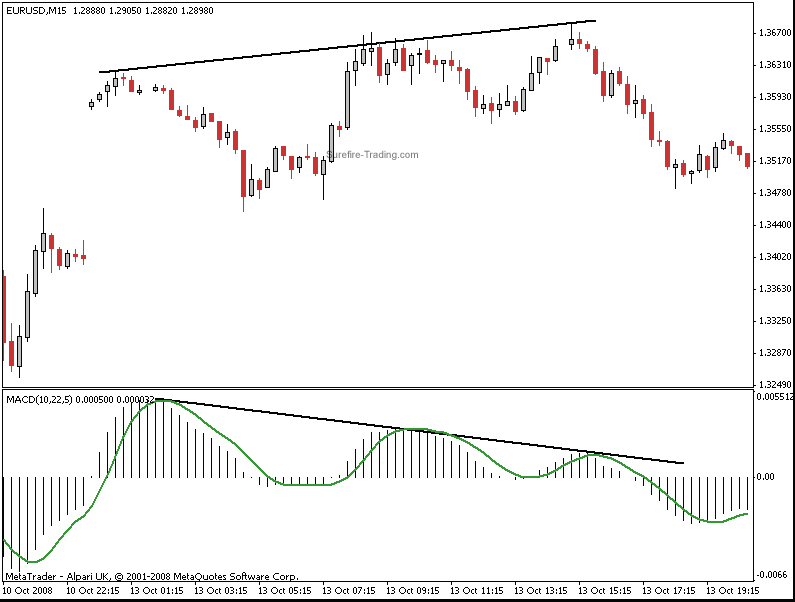
Bearish Divergence is displayed when price reaches higher highs while the coinciding indicator reaches lower highs.
THEN
-
In contrast, Bullish Hidden Divergence is displayed when price reaches higher lows while the coinciding indicator reaches lower lows.
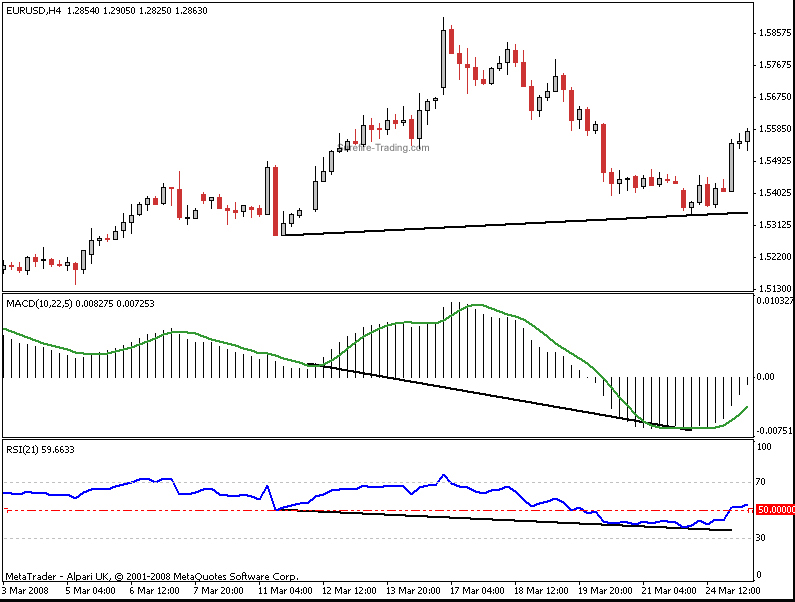
Remember: The original trend (below) was bullish (red) and so the HD formation signals a potential return to the bullish trend.
Click To Play The Video

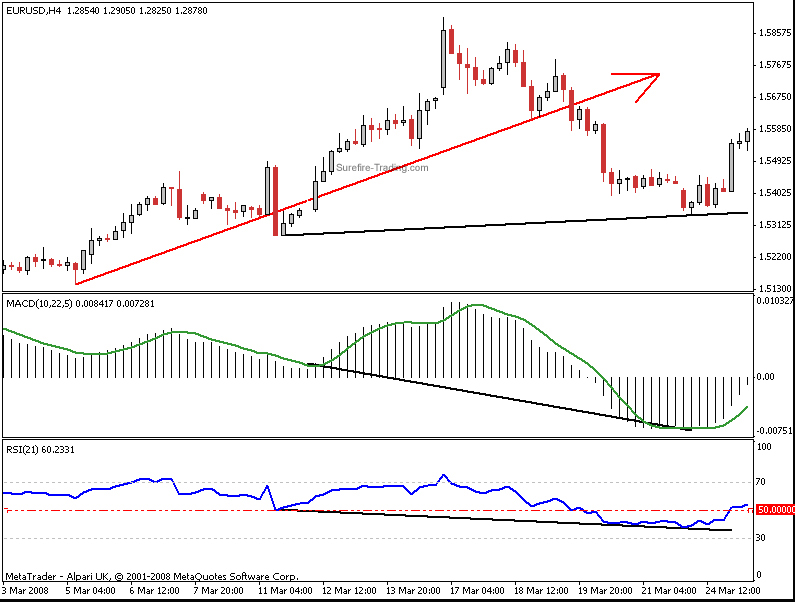
When the hidden divergent signal is confirmed with T/L breaks on the price chart and the RSI is followed by a subsequent pullback to the price T/L while the RSI has moved into bullish territory...
-
We have no fear of entering on the long side of the market.
-
Entering anywhere within the shaded area (below) would be a high probability trade.
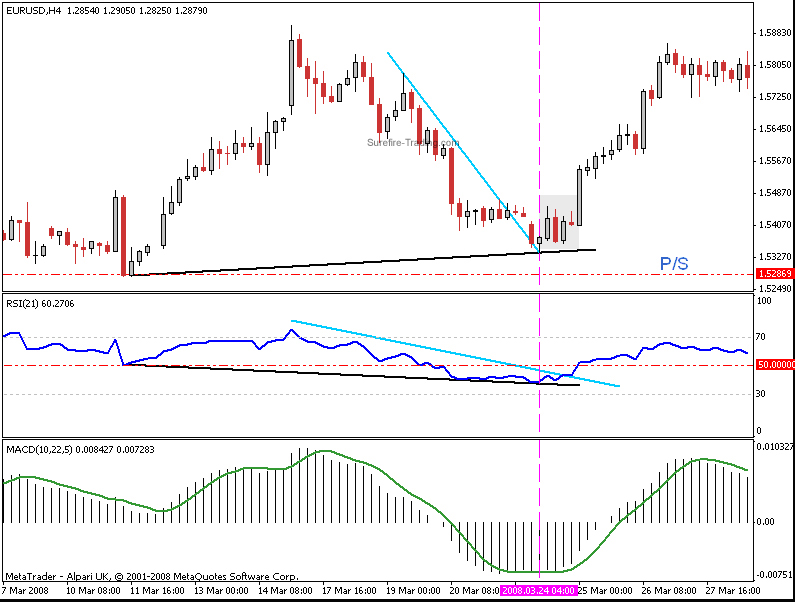
Upon entry, a protective stop (P/S) immediately placed just below the previous low provides us with a safety net with a risk factor of only 30 pips.
And as we can see below, the bullish ride would have been substantial.

LIKEWISE
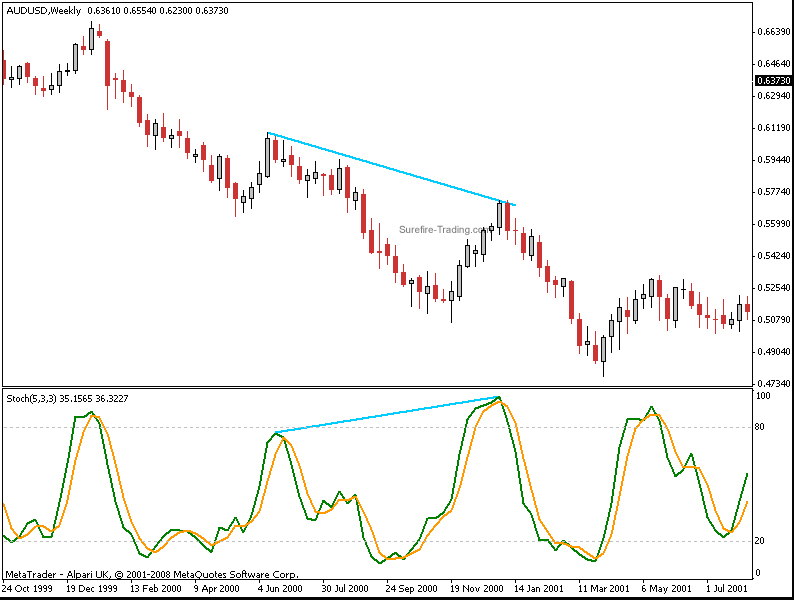
In a down-trending market, Bearish Hidden Divergence is displayed when price reaches lower highs while the coinciding indicator reaches higher highs.
In the chart below, a retracement of the price coincides with a distinct higher high (from one clearly defined peak to the next clearly defined peak) on the Stochastic indicating a potential for a continued bearish move.
With confirmation (below) being provided by a break of the T/L (red) on the price chart with a subsequent break of the T/L on the RSI coinciding with the RSI remaining in bearish territory...
-
Once again, we have no fear of re-entering the market on the short side.
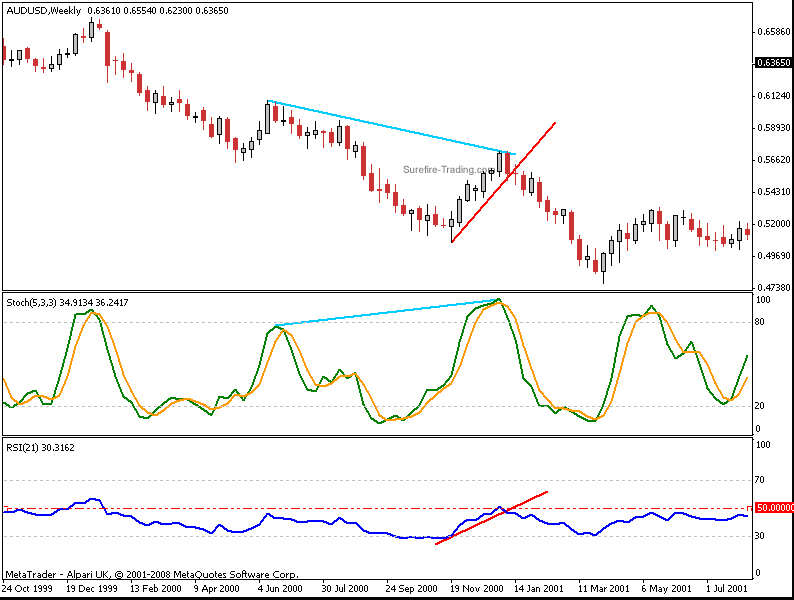
With your P/S placed just above the previous high, you can sleep like a baby.
Below is a nice little cheat sheet you can copy and cut out and set by your keyboard until you get it set in your mind
..I did
..and it works great.
| Divergence Type |
Price |
Oscillator |
Trade |
| Regular |
Higher High |
Lower High |
SELL |
| Regular |
Lower Low |
Higher Low |
BUY |
| Hidden |
Higher Low |
Lower Low |
BUY |
| Hidden |
Lower High |
Higher High |
SELL |
With Surefire-Trading.com, this is Ty Young, reminding you to Read the Charts.
Ty Young
Surefire-Trading.com
Access this 495.27% strategy absolutely FREE
If You Want To Learn How To Turn $150 Into $7,523.54 In under 30 Days With A Simple System
Enter your valid email for instant access:
|
|
|
Information, charts or examples contained in this lesson are for illustration and educational purposes only. It should not be considered as advice or a recommendation to buy or sell any security or financial instrument. We do not and cannot offer investment advice. For further information please read our disclaimer.
|
|