Moving Averages
Our Experts Have Already Helped Countless People Around The World...
Introduction
Many Novice traders are aware of certain of the more well known Indicators but are really not well versed in how to use them. In each edition I’m going to elaborate on a particular Indicator which should also provide good grounding for traders that might be a little “rusty” on their knowledge. We start in this edition with Moving Averages (Ma’s) and I include also a method of trading it.
The Moving Average (MA) is one of the most widely used technical analysis tools, simply because of its usefulness in identifying trend. Moving Averages smooth price movement. Price fluctuates up and down and may be seen as erratic. However, the moving average will appear as a sloped or curved line, allowing you to see the real bias in the direction of the market.
Obviously, by the name itself, the moving average is an average that moves. That’s because this average is computed based on the latest number of candles, and this number depends on what you set it to be.
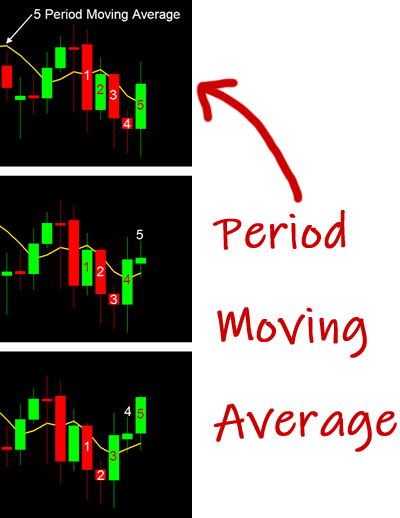
Take for example the 5 Period Simple Moving Average on the image to the right. The golden line shows the average of the most recent 5 candles. As new candles form, it will compute the average again, dropping the data of the oldest candle.
There are many types of moving averages but they all serve a main purpose, and that is to smooth the price movement to reveal the trend.
Moving averages are also used to identify support and resistance levels.
It is also uncommon for moving averages to be applied over other indicators to smooth the data (i.e. Oscillators). Aside from that, they are used as integral parts of other indicators (i.e. Bollinger Bands).
Once traders can identify the trend, trading in the same direction will greatly increase the odds in their favor.
Take note however, that this does not mean that it predicts where the price will go. What it does instead is to identify which direction the price is moving based on the past number of prices. In effect, they are actually lagging behind the price, and thus it is called a lagging indicator. Nonetheless, moving averages are very effective in filtering out the noise in the market.
Types of Moving Averages
There are three basic types of moving averages but most traders use the simple (SMA) and the exponential (EMA) moving averages.
1. Simple Moving Average (SMA)
This is the simplest form of moving average, computed as the sum of the most recent closing prices divided by the number of periods or candles.
For example, for a 5 Period Moving Average, the recent 5 closing prices are added together then divided by 5.
As you can see on the formula above, each closing price is given equal weight and thus impacts the result equally.
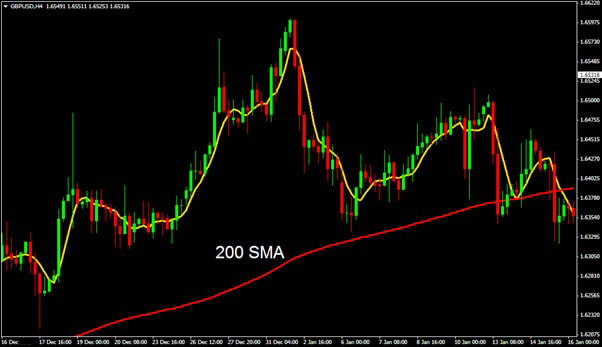
Higher periods of this type of moving average are useful in identifying the long term trend of the market. It can help identify if the recent price is falling or rising compared to the long term trend. Below, you can see that price is fluctuating and it may be hard to determine exactly where it’s going. By having a 200 SMA in place, you can see that it’s sloping upward and price is above the SMA. This indicates that the long term trend is an uptrend.
2. Exponential Moving Average (EMA)
This moving average was invented because many experts believe that not all prices are equal. Most recent prices are more important and thus should be given more weight in the calculation. To achieve this, a smoothing factor is applied to give a higher weight on the more recent data. These calculations are done automatically by trading platforms so there’s really no need for traders to get into much detail on this.
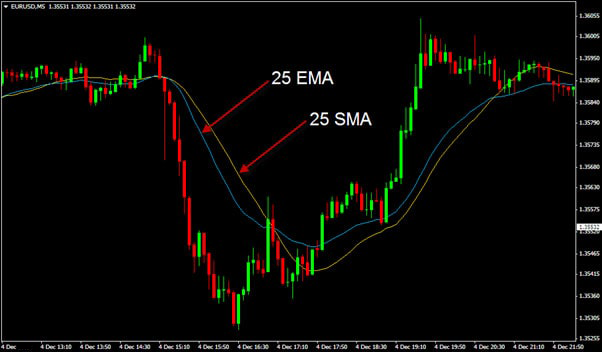
Now that the moving average is more reflective of recent price movements, it has become a favorite among many technical traders. Below, you can see the difference between the 25 EMA and 25 SMA. You can see that the EMA is following price more closely than the SMA. This small difference in the types of moving average can make a big difference in trading results.
3. Linear Weighted Average (LWMA)
The least common type of moving average is the Linear Weighted Average. It was also invented to give more importance to recent prices, but the computation is different from that of the EMA. Here, each price is multiplied by its position in the series of prices, then added together and divided by the sum of the number of multipliers. For example, in a 5 period moving average, the most recent price is multiplied by 5, then the previous by 4, and the price before that by 3, the next is multiplied by 2 and the last candle by 1. Then the sum of the results are divided by the sum of the multipliers.
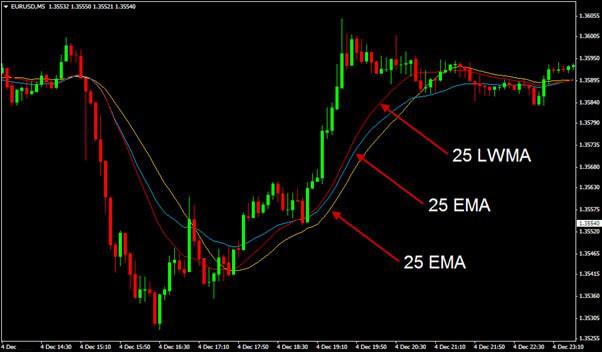
Below is a comparison of the 3 types of moving averages. The red colored line is the Linear Weighted Moving Average. You can clearly see that it is the most reactive to the price movement.
Uses of Moving Averages
Moving averages are used in many ways, mainly to identify trends and reversals, as well as dynamic support and resistance levels. In this section, I will show you all the different uses of moving averages.
1. Identifying the Trend
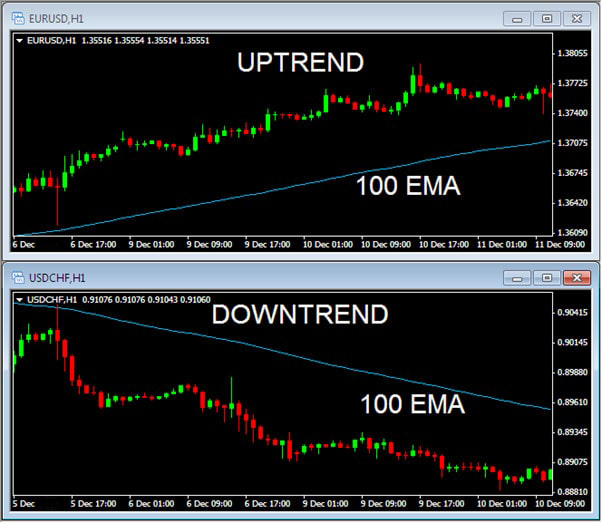
To identify the main trend, a higher period moving average can be used, such as 50, 100 or 200. If the moving average is sloping upward and the price is found above it, then you have an uptrend. But when price closes under the moving average, such that it will continue moving under it and the moving average is sloping down, then you have a downtrend.
You can also use more than one moving average to identify the trend. One of these moving averages has to have a shorter period setting. Below, you can see the 50 EMA had crossed above the 100 EMA and the price is above both EMAs. This means that an uptrend is emerging.
But when price crossed under both EMAs and the 50 EMA crossed under the 100 EMA, then you have a downtrend.
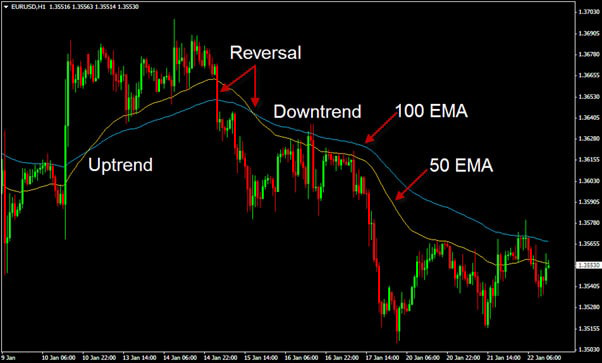
A reversal in the trend is identified when the price starts to cross to the other side of the shorter period moving average and is completed when the shorter period moving average has crossed to the other side of the higher period moving average as you can see on the image above.
When using only one moving average, you can tell that the trend has reversed when you see that price has completely crossed to the other side of the moving average. As an added confirmation, a second touch of the moving average may be seen before price continues to move to the new direction.
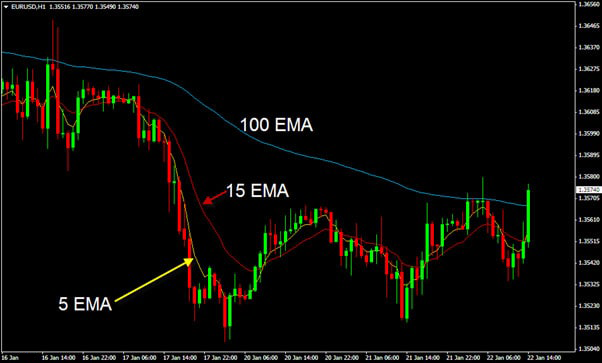
However, some traders use more than two moving average, adding a much shorter period moving average, such as 5 and 15, to the long period moving average. These shorter period moving averages may cross each other without crossing the longest period moving average. This means that there is a temporary reversal in the short-term trend, however, the main trend remains the same.
Below, you can see the 5, 15 and 100 EMAs. The 5 and 15 EMAs cross each other but they remain under the 100 EMA. This shows that although the main trend is up, price is making small reversals before continuing in the downward direction.
2. Identifying the Strength of the Trend
Moving averages also help in identifying the momentum or strength of the trend. As traders, we want to get the most odds in our favor, and this involves careful selection of the market condition before trading. A market with a good momentum in a trend is ideal because it’s easier to achieve your profit, compared to that of a weak momentum.
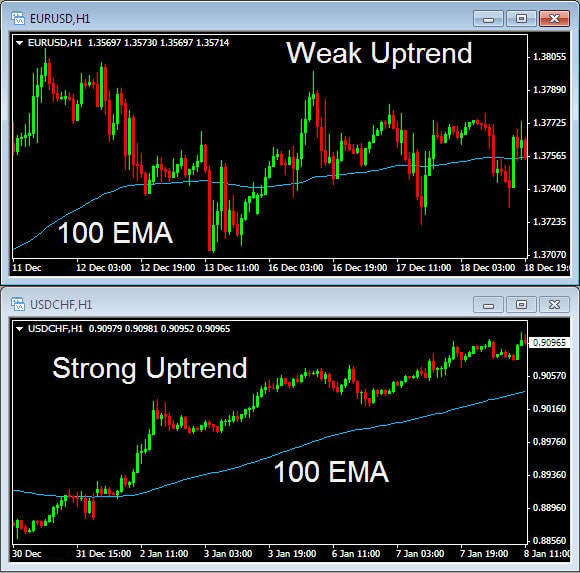
Have a look at the images below. The 100 EMA is slightly slanted upward on the top image (EURUSD), while it shows a steeper slope on the bottom image (USDCHF). Between these two pairs, at this given moment, trading on the USDCHF can give you better trading results.
3. Dynamic Support & Resistance
Moving averages are also used to identify levels of support and resistance. The 200 period moving average is the most popular. Below is the 200 EMA applied on the GBPUSD 4 hour chart and is being used as a major support line. Notice that when price touched the EMA, it reversed back up. However should price close under the 200 EMA, it can be seen as a sign of trend reversal.
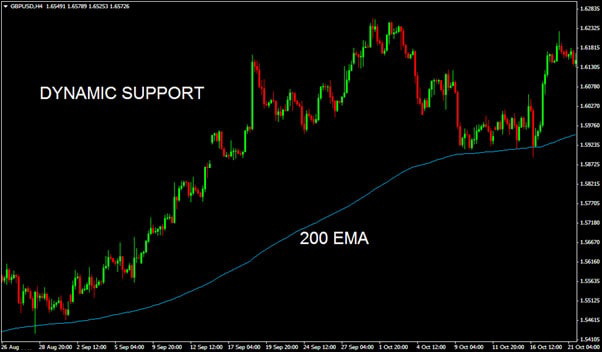
In an uptrend, the moving average serves as a dynamic support line, which means, price will stay above this line until it breaks under it and forms a new trend. If it does, the previous support line will now turn into a resistance line.
4. Entry & Exit Signal
The crossovers of moving averages may serve as basic signals for entering or exiting a trade.
Below you can see that a sell trade signal occurs when the 5 EMA crosses under the 15 EMA, and a buy signal occurs when the 5 EMA crosses above the 15 EMA.
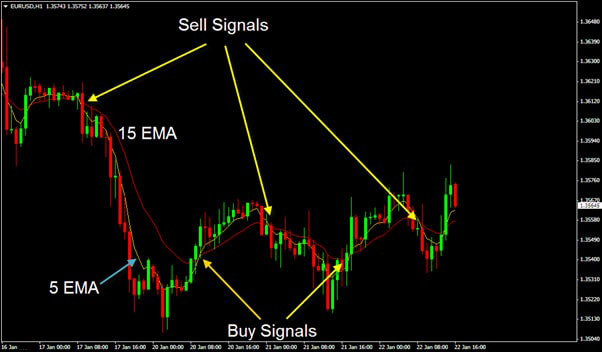
Take note that these entry signals need to be filtered as not all crossovers are profitable. We want to place our trades with the best trading signals, and to do this, we need to use other indicators and techniques to filter out bad signals.
Application
In order to illustrate all these functions of moving averages, I will show you a simple trading method using the 5, 15 and 100 EMAs.
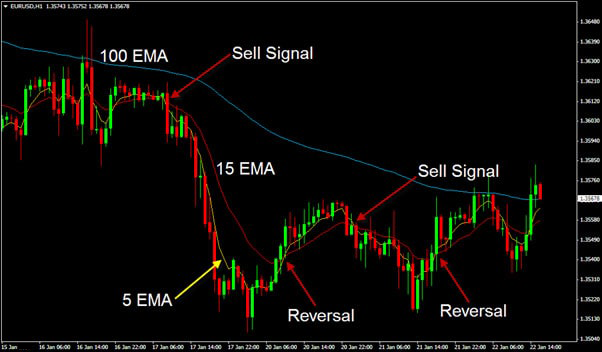
Below, you can see the 100 EMA is sloping down nicely, so we have a downtrend. The sell signals are based on the 5 EMA (yellow) crossing under the 15 EMA (red). If you place a sell trade, you’ll need a take profit, however, if price doesn’t hit the take profit and the 5 EMA crosses back above the 15 EMA, you’ll need to exit the trade because a reversal may occur. This reversal can either be temporary or permanent.
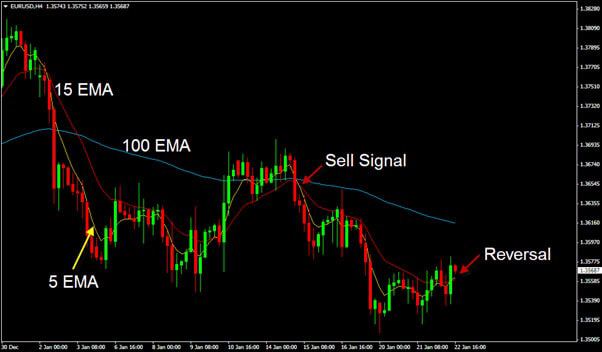
Here’s another example. On the EURUSD 4 hour chart, we have a nice downtrend, so we should look for a sell trade. We get this opportunity when the 5 EMA crossed under the 15 EMA, which is already under the 100 EMA.
The trade can be closed with a profit of 50 pips, but if there was no take profit in place, it needs to be closed when the 5 EMA crossed back above the 15 EMA.
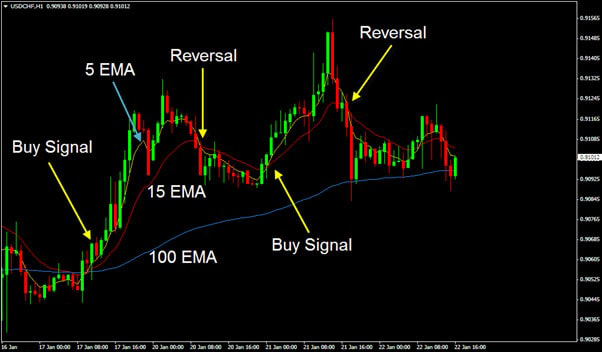
Let’s take a look at one more example. We have an uptrend on the USDCHF 1 hour chart. The first buy signal appears when the 5 EMA crossed above the 15 EMA and both are above the 100 EMA. This upward move peaked at 65 pips, so if the take profit was set at 30 pips, that would have easily been achieved. However, without a take profit, the trade needs to be closed when the 5 EMA crossed under the 15 EMA. The next buy signal that followed had price going up for 45 pips before reversing. Again, a trade of 30 pips take profit would easily be achieved, otherwise, it will have to be closed as the 5 EMA crossed under the 15 EMA.
Summary
By now, I’m sure you are very excited to get started at trading with the moving averages. And I’m glad that you got to this point because it’s always best to know as much as you can about the tools or indicators to use before actually trading with them.
Moving averages smooth data on your chart and this makes them great in identifying the trend, gauging its momentum, identifying dynamic support and resistance areas and identifying trade entries. It’s a very versatile indicator and that’s why many trading systems out there use moving averages a lot.
The most common moving averages used are the 5, 10, 20, 50, 100 and 200 period moving averages. You are free to use any setting you like if you find them more suitable to your trading style.
To your success
Tradeology Team