RVI Indicator
The idea behind the Relative Vigor Index (RVI) is basic prices tend to close higher than they open in up markets and close lower than they open in down markets. The vigor, or energy, of the move is thus established by where the prices end up at the close.
First Some History
The Relative Vigor Index (RVI) was constructed by John Ehlers who is also the creator of the highly acclaimed MESA and EPOCH trading programs. He is an acknowledged expert in the use of cycles in technical trading
Calculation of the RVI
To normalize the index to the daily trading range, divide the change of price by the maximum range of price for the day. Thus, the basic equation for the RVI is:
RVI = (Close-Open) / (High-Low)
Where:
OPEN is the opening price;
HIGH is the maximum price;
LOW is the minimum price;
CLOSE is the closing price.
How the RVI is created.
The main point of Relative Vigor Index Technical Indicator (RVI) is that in a bull market the closing price is, as a rule, higher, than the opening price. It is the other way around on the bear market. So the idea behind the Relative Vigor Index is that the vigor, or energy, of the move is thus established by where the price ends up at the close.
To normalize the index to the daily trading range, divide the change of price by the maximum range in price for the day. To make a more smooth calculation, one uses a simple moving average. 10 is the best period.
To avoid probable ambiguity one needs to construct a signal line, which is a 4-period symmetrically weighted moving average of the Relative Vigor Index values.
The concurrence of lines serves as a signal to buy or to sell.
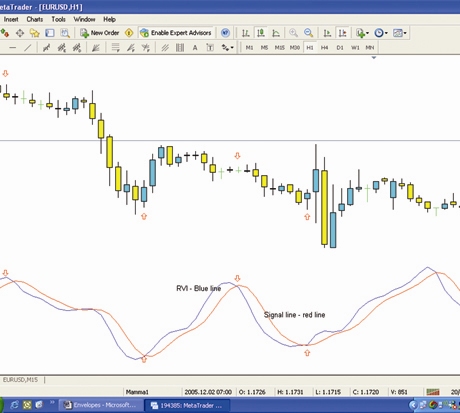
Below is a 1hr chart of the EUR/USD with the default setting of the RVI shown. A red line is drawn which is the signal line. This is a 10 period simple moving average.
A blue RVI line is drawn, which is a 4-period symmetrically weighted moving average of RVI values taken from the calculation.
Access this 495.27% strategy absolutely FREE
If You Want To Learn How To Turn $150 Into $7,523.54 In under 30 Days With A Simple System
Enter your valid email for instant access:
|
|
|
Market Psychology
Each price reflects the consensus of value among the mass of market participants at the moment of the trade. A moving average represents an average consensus of values in a selected period here a 10 period simple moving average is used for the signal line (Red).
The fast RVI line (Blue) represents the vigor, or energy of the move, which is established by where the prices end up at the close and reflects mass consensus over a short period. The slower signal line (red) reflects mass consensus over a longer period.
When the fast RVI line (Blue) rises above the slow signal line (Red), it shows, that bulls dominate the market, and it is better to trade from the long side. When the fast RVI line (Blue) falls below the slow line (Red), it shows, that bears dominate the market and it pays to trade from the short side.
Trading Rules
Crossovers between the RVI and signal lines identify changing market tides. Trading in the direction of a crossover means going with the flow of the market.
-
When the fast RVI line (Blue) crosses above the slow signal line (Red), it gives a buy signal. Consider going long, and place a protective stop below the latest minor low.
-
When the fast RVI line (Blue) crosses below the signal line (Red), it gives a sell signal. Consider going short, and place a protective stop above the latest minor high.
More on the RVI
This indicator does not show over sold or bought zones. So, you have to keep these levels in consideration using another indicator.
May The Trade Be With You
Danie van Wyk
Information, charts or examples contained in this lesson are for illustration and educational purposes only. It should not be considered as advice or a recommendation to buy or sell any security or financial instrument. We do not and cannot offer investment advice.
|
|